1/29/2025
Deep Dive into the Performance Metrics of Modern Open-Source AI Models
In the rapidly evolving world of artificial intelligence, the performance of AI models is a hot topic. Open-source AI models, in particular, have gained massive popularity due to their accessibility & the freedom they provide for customization. But how do we measure the performance of these models effectively? In this blog post, we'll take a thorough look at the performance metrics that are commonly used to gauge the success of modern open-source AI models.
What are Performance Metrics?
Performance metrics are quantitative measurements that assess how well an AI model performs a specific task. They are crucial for various reasons: they help us understand how a model behaves under different conditions, allow for comparisons across different models, & guide further improvements. Without these metrics, evaluating the success of a model would be like sailing a ship without a compass.
Why are Performance Metrics Important?
Tracking performance metrics is essential for:
- Evaluating Model Quality: Ensuring the accuracy of the predictions.
- Identifying Areas for Improvement: Metrics can reveal weaknesses in the model.
- Enhancing User Experience: A better-performing model translates into higher satisfaction and engagement from users.
- Maximizing ROI: By refining models based on these metrics, businesses can ensure their investments yield better results.
Key Performance Metrics for AI Models
When it comes to open-source AI models, several performance metrics stand out, each serving a distinct purpose. Let's dive into the most common metrics used today:
1. Accuracy
Accuracy is perhaps the most straightforward metric. It measures the percentage of correct predictions made by the model out of total predictions. While it’s a great metric for balanced datasets, it becomes less useful when the data is imbalanced — for example, if one class is significantly more prevalent than another.
Formula:
1Accuracy = (TP + TN) / (TP + TN + FP + FN)
Where:
- TP: True Positives
- TN: True Negatives
- FP: False Positives
- FN: False Negatives
2. Precision
Precision evaluates how many of the predicted positive cases were actually correct. This is particularly useful in scenarios where the cost of false positives is high.
Formula:
1Precision = TP / (TP + FP)
3. Recall (Sensitivity)
Recall measures the ability of a model to find all the relevant cases (true positives). It's crucial in situations where missing a positive case could have serious consequences.
Formula:
1Recall = TP / (TP + FN)
4. F1 Score
The F1 Score is the harmonic mean of precision & recall. It provides a balance between the two, making it a valuable metric when you need a single measure to evaluate a model's performance.
Formula:
1F1 = 2 * (Precision * Recall) / (Precision + Recall)
5. ROC Curve & AUC
The Receiver Operating Characteristic (ROC) curve is a graphical representation of a model’s diagnostic ability. The AUC (Area Under Curve) of the ROC provides an aggregate measure of performance across all classification thresholds, offering insight into how well the model separates the classes.
6. Mean Absolute Error (MAE)
MAE is used predominantly in regression tasks. It measures the average magnitude of errors in a set of predictions, without considering their direction. MAE is a simple metric to interpret as it tells you how far off the predictions are on average from the actual results.
Formula:
1MAE = (1/n) * ∑|y_i - ŷ_i|
Where:
- y: actual value
- ŷ: predicted value
- n: number of observations
7. Mean Squared Error (MSE)
MSE, another regression metric, measures the average of the squares of the errors—that is, the average squared difference between estimated values and actual value. It’s more sensitive to outliers than MAE but is widely used for its desirable properties in optimization.
Formula:
1MSE = (1/n) * ∑(y_i - ŷ_i)²
8. R-Squared (R²)
R² indicates how well data points fit a statistical model. It ranges from 0 to 1, where a value of 1 indicates that the model perfectly predicts the outcome. A higher R² value generally indicates a better fit for the data.
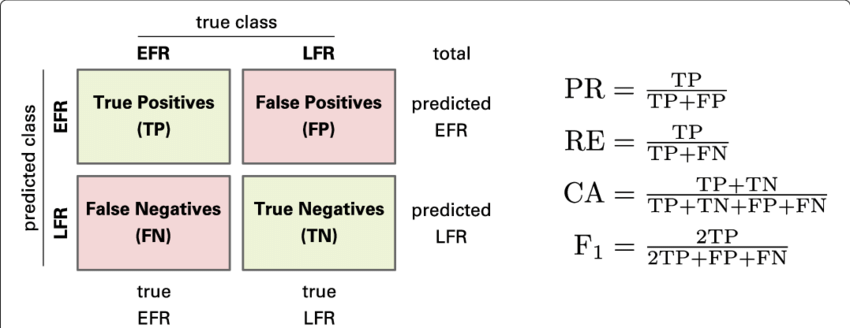
9. Confusion Matrix
A confusion matrix is a summary of prediction results on a classification problem, showing how many predictions were correct (true positives & true negatives) and how many were incorrect (false positives & false negatives). This gives a clear picture of how the model is performing.
Evaluating AI Models: A Practical Approach
With so many metrics available, how do you choose the right one? Here’s a suggested approach:
- Understand Your Use Case: The metrics you prioritize will depend on the specific tasks your model performs. For instance, a healthcare application may prioritize recall over precision, while a marketing tool may require the opposite.
- Use Multiple Metrics: Instead of relying on one metric, consider using a combination to get a well-rounded view of model performance. For example, both precision & recall provide different perspectives on how the model is behaving.
- Monitor Performance Post-Deployment: Once deployed, it's essential to monitor how your model performs over time, as data drift can affect its accuracy & efficiency. Metrics like accuracy, precision, & recall will help track ongoing model effectiveness.
Real-World Applications of Open-Source AI Models
Open-source AI models have shown tremendous capabilities across industries. Here are a few examples:
1. Natural Language Processing (NLP)
Open-source models like Llama 3 have redefined capabilities in NLP, achieving state-of-the-art performance in understanding and generating human-like text.
2. Computer Vision
Models such as EfficientNet have improved image classification tasks, demonstrating better efficiency & accuracy through various performance metrics.
3. Healthcare
AI applications in healthcare have leveraged open-source models to predict patient conditions based on historical data, continually improving through metrics that focus on accuracy & recall.
Continuous Improvement with Insights from Data
The beauty of open-source AI models lies in their adaptability. Organizations can access performance metrics and make iterative improvements based on real-world data. By tracking these metrics effectively, businesses can fine-tune their AI capabilities to meet evolving needs.
Gain Insights with Arsturn
If you’re looking to harness the power of conversational AI, consider using Arsturn. This innovative platform allows you to create custom chatbots effortlessly and engage your audience effectively. Designed for various needs, whether you’re a business owner or influencer, Arsturn provides instant responses, insightful analytics, & full customization.
Explore how easily you can create your own chatbot in just three steps with Arsturn:
- Design Your Chatbot: Tailor its appearance to match your brand.
- Train with Your Data: Upload various file types or use your website content.
- Engage Your Audience: Start connecting with users effectively!
Join the growing community utilizing conversational AI to boost engagement & conversions! No credit card is required to claim your chatbot, so why wait?
Conclusion
Evaluating the performance of open-source AI models is paramount in today’s data-driven environment. By understanding & leveraging the right performance metrics, organizations can improve their models significantly, ensuring they are fit for purpose. Whether for NLP, computer vision, or healthcare applications, these metrics guide you in building smarter, more effective AI systems. With platforms like Arsturn, the potential for engagement & conversion has never been higher. Dive in, explore the metrics, & start creating AI solutions that work for you!